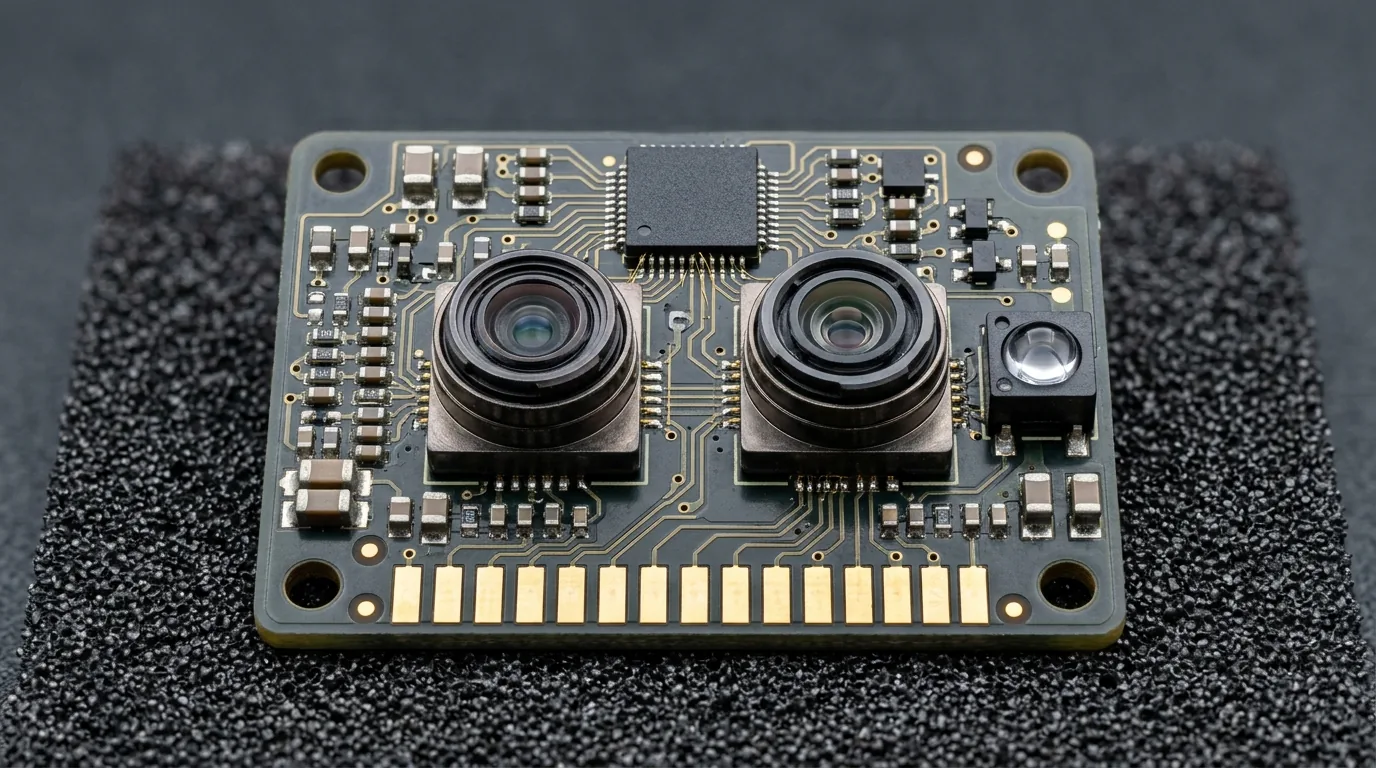



Architectural Foundations: Why Raw TFLOPS Matter Less Than You Think
Nintendo Switch 2 delivers approximately 4 TFLOPS of GPU performance. PlayStation 5 produces 10.28 TFLOPS. Xbox Series X reaches 12 TFLOPS. These specifications appear on retail packaging and in manufacturer marketing materials, but raw TFLOPS numbers alone do not fully explain how each platform performs in actual games. Understanding the architectural differences beneath these figures reveals why the comparison requires more context than a simple specification sheet provides.
Nintendo Switch 2 houses a custom NVIDIA T239 chip built on the Ampere architecture.[1][9] This processor contains 1536 CUDA cores and delivers approximately 4 TFLOPS of computational power in docked mode. The architecture represents a mobile-first design adapted from NVIDIA's laptop GPU lineup, which means engineers optimized it for power efficiency and heat management within strict thermal constraints. The chip cannot sustain peak performance indefinitely because the physical design prioritizes the handheld experience alongside dock operation.
PlayStation 5 and Xbox Series X both use AMD designs, but their implementations differ substantially. Sony's console pairs an AMD Zen 2 CPU with a custom RDNA 2 GPU producing 10.28 TFLOPS. Microsoft pushed the specification further with 12 TFLOPS from 52 compute units running at 1.825 GHz on its custom RDNA 2 processor. These numbers represent sustained desktop-class performance in a fixed location with consistent power delivery and strong thermal solutions, including liquid metal application inside the PS5.
Memory architecture creates one of the most significant performance divides in this comparison. Switch 2 utilizes 8 GB of unified LPDDR5 RAM sharing a single pool between the processor and graphics subsystem. This configuration delivers 88 GB/s of memory bandwidth. PlayStation 5 doubles the memory to 16 GB of dedicated GDDR6 RAM operating at 448 GB/s, while Xbox Series X reaches 560 GB/s with its 16 GB GDDR6 configuration. Bandwidth directly affects how quickly the GPU can access texture data, render targets, and computational working sets. Higher bandwidth allows consoles to maintain larger frame buffers, load higher-resolution assets, and avoid pipeline stalls that reduce effective performance below theoretical TFLOPS ratings.[1][2][3] The same bandwidth-versus-capacity tension shows up on the phone side, where the Pixel 10's Tensor G5 makes the same trade at a fraction of the scale, and that comparison is broken down in our Tensor G5 analysis.
The three platforms also employ fundamentally different rendering strategies to achieve their performance targets. Nintendo's hardware relies heavily on NVIDIA DLSS technology, which uses AI upscaling to render at lower internal resolutions and reconstruct output at higher display resolutions. This approach allows the Switch 2 to achieve visual fidelity that would require substantially more raw GPU power without DLSS. Sony and Microsoft rely on traditional rendering pipelines with more direct GPU compute, supplemented by their own upscaling solutions like PlayStation Spectral Super Resolution.

| Field | Switch 2 | PlayStation 5 | Xbox Series X |
|---|---|---|---|
| GPU | NVIDIA T239 (custom Ampere) | Custom AMD RDNA 2 | Custom AMD RDNA 2 (52 CUs @ 1.825 GHz) |
| CUDA / compute units | 1536 CUDA cores | 36 CUs @ 2.23 GHz | 52 CUs @ 1.825 GHz |
| Peak TFLOPS | ~4 TFLOPS (docked) | 10.28 TFLOPS | 12 TFLOPS |
| CPU | ARM Cortex-A78C, 8 cores | AMD Zen 2, 8 cores @ 3.5 GHz | AMD Zen 2, 8 cores @ 3.8 GHz |
| Memory | 8 GB unified LPDDR5 | 16 GB GDDR6 | 16 GB GDDR6 |
| Memory bandwidth | ~88 GB/s | 448 GB/s | 560 GB/s |
| Form factor | Handheld + dock | Console (fixed) | Console (fixed) |
| Thermal priority | Power efficiency + handheld | Sustained desktop-class | Sustained desktop-class |
| Field | Switch 2 | PlayStation 5 | Xbox Series X |
|---|---|---|---|
| GPU | NVIDIA T239 (custom Ampere) | Custom AMD RDNA 2 | Custom AMD RDNA 2 (52 CUs @ 1.825 GHz) |
| CUDA / compute units | 1536 CUDA cores | 36 CUs @ 2.23 GHz | 52 CUs @ 1.825 GHz |
| Peak TFLOPS | ~4 TFLOPS (docked) | 10.28 TFLOPS | 12 TFLOPS |
| CPU | ARM Cortex-A78C, 8 cores | AMD Zen 2, 8 cores @ 3.5 GHz | AMD Zen 2, 8 cores @ 3.8 GHz |
| Memory | 8 GB unified LPDDR5 | 16 GB GDDR6 | 16 GB GDDR6 |
| Memory bandwidth | ~88 GB/s | 448 GB/s | 560 GB/s |
| Form factor | Handheld + dock | Console (fixed) | Console (fixed) |
| Thermal priority | Power efficiency + handheld | Sustained desktop-class | Sustained desktop-class |
Real-World Gaming Benchmarks: Frame Rates Across Major Titles
Digital Foundry benchmark testing in June 2026 demonstrated how each platform handles identical game workloads under standardized conditions. Cyberpunk 2077 serves as the primary comparison title because its developers have released builds for all three platforms, enabling direct frame rate analysis across different hardware architectures.
Nintendo Switch 2 docked achieves 30-40 FPS when running Cyberpunk 2077 at 4K equivalent resolution. The system employs aggressive DLSS Super Resolution to reconstruct output from a substantially lower internal render resolution. In handheld mode, the console maintains a 1080p60 baseline using DLSS Quality mode, which renders at a lower internal resolution and reconstructs the image while preserving visual detail in motion. The gap between docked and handheld performance reflects the thermal and power constraints of the mobile form factor, which limits GPU clock speeds during extended portable play.
PlayStation 5 maintains 60 FPS at native 4K resolution in Cyberpunk 2077. Sony's hardware lacks the resolution scaling techniques that Nintendo employs, instead delivering the image at full display resolution without reconstruction. This approach demands more from the GPU but produces sharper output in scenes with fine texturing details. The PS5 fan curves and liquid metal thermal solution maintain consistent performance without throttling during multi-hour sessions.
Xbox Series X delivers 55-60 FPS in the same Cyberpunk 2077 benchmark at native 4K resolution. Microsoft's console uses aggressive rate pacing to stay closer to 60 FPS target than the PS5, which occasionally allows frame rates to dip during the most demanding open-world scenes. Both Sony and Microsoft consoles substantially outperform Switch 2 in raw frame rate measurements, though the comparison measures different engineering priorities rather than quality hierarchies.
Storage performance influences loading times and asset streaming during gameplay. Eurogamer testing in June 2026 showed Switch 2 load times running 40-60% faster than the original Switch when using microSD Express expansion storage. However, PS5 and Xbox Series X SSD speeds remain 2-3 times faster than Switch 2 storage, which affects open-world asset streaming and fast travel loading screens in data-heavy titles.

Thermal Performance and Power Efficiency Under Sustained Load
Extended gaming sessions reveal the true character of a console's thermal management system. Unlike brief benchmarks that show peak performance, sustained play exposes how hardware prioritizes heat removal, fan noise, and power draw over multi-hour periods.
The Nintendo Switch 2 employs a vapor chamber cooling solution paired with a single centrifugal fan. AnandTech's thermal imaging tests during two-hour gameplay sessions recorded surface temperatures remaining below 45°C in docked mode.[6] The fan operates at 25-30 dB under typical loads, which translates to audibly quiet operation that does not compete with game audio at normal listening volumes. This acoustic performance represents a meaningful improvement over the original Switch, which could become notably whiny during graphically demanding titles.
Sony's PlayStation 5 and Microsoft's Xbox Series X both use fixed-location designs with more aggressive thermal solutions. The PS5 employs liquid metal thermal compound between the APU and heatsink, a technique borrowed from high-end PC components that dramatically improves heat transfer compared to traditional thermal paste. The Xbox Series X relies on a larger heatsink with heat pipes and a tertiary fan configuration. Both platforms operate at higher absolute power draw than the Switch 2, with total system consumption ranging from 50-200W depending on game intensity.
The fundamental distinction between these approaches lies in power delivery architecture. The Switch 2 houses a 52 Wh battery that decouples gaming from wall power. IGN's standardized battery drain testing measured between 2 and 6.5 hours of gameplay depending on title intensity. Demanding games like open-world titles push toward the lower end, while 2D platformers or older backwards-compatible games extend runtime significantly. Both the PS5 and Xbox Series X require constant AC connection with no battery backup whatsoever.
Storage performance intersects with thermal management in meaningful ways. Eurogamer's load time testing showed the Switch 2's microSD Express storage delivers 40-60% faster game loading than the original Switch but remains 2-3x slower than the custom NVMe SSDs in Sony and Microsoft's platforms. Faster storage reduces CPU idle time during asset streaming, which can lower sustained power draw during open-world gameplay where the console frequently transitions between loading and rendering phases.
For users prioritizing quiet environments or flexible play locations, the Switch 2's thermal profile offers clear advantages. The lower sustained temperatures reduce long-term component stress, and the battery-backed design eliminates dependency on power outlet proximity. However, this portability comes with inherent performance trade-offs that become apparent when comparing frame rate stability during hour-long sessions against consoles that can draw unlimited power from wall outlets.

Pricing Strategy and Regional Value Analysis for USA and UK Markets
Launch pricing reveals distinct market positioning strategies across the three platforms. Nintendo priced the Switch 2 at $349.99 in the United States and £349.99 in the United Kingdom.[8] The PlayStation 5 launched at $499.99 in the USA and £479.99 in the UK. The Xbox Series X entered the market at $499.99 in the USA and £449.99 in the UK, according to GamesIndustry.biz retail tracking data.
Regional currency differences create divergent pricing realities for buyers on each side of the Atlantic. The PS5's UK price of £479.99 and Xbox Series X at £449.99 exceed their US equivalents by different margins when converted. The Switch 2 carries the same numerical price in both markets, though currency conversion rates mean the actual pound-to-dollar value fluctuates independently of retail pricing decisions made by each manufacturer.
Cost-per-TFLOPS calculations provide a standardized comparison metric. Nintendo's 4 TFLOPS of raw compute translates to approximately $87.50 per TFLOPS. Sony's 10.28 TFLOPS figure yields roughly $48.63 per TFLOPS, and Microsoft's 12 TFLOPS architecture provides approximately $41.67 per TFLOPS. These calculations demonstrate that while the Switch 2 carries the lowest sticker price, the console provides the highest cost-per-unit of raw graphical compute among the three platforms.
TFLOPS comparisons alone fail to capture the complete ownership equation. Nintendo's hybrid design bundles handheld and home console functionality within a single purchase. The system operates in handheld mode and connects to a television when docked, with Joy-Con 2 controllers and an integrated kickstand enabling tabletop play. Both the PS5 and Xbox Series X require constant AC connection and lack built-in portable functionality.
Storage expansion costs factor into long-term ownership calculations as well. The Switch 2 supports microSD Express cards for expandable storage up to 2 TB, according to Eurogamer storage analysis. Players should factor these potential storage costs into multi-year budget projections, as digital game libraries continue to grow across all platforms.
Subscription service pricing structures differ substantially between platforms. Nintendo Switch Online Individual costs $3.99 per month or $34.99 per year, providing access to online multiplayer and a selection of retro titles. Xbox Game Pass Ultimate runs $16.99 monthly or $139.99 annually, bundling online access with a large game library and cloud gaming capabilities. Over a three-year ownership period, Xbox Game Pass Ultimate costs approximately $420 compared to roughly $105 for Nintendo Switch Online at the base tier. These recurring expenses layer differently depending on which service tier and platform a buyer chooses.
For budget-conscious buyers in 2026, the Switch 2 presents the lowest entry point for next-generation gaming. Tech-interested readers who prioritize raw performance and native 4K output will find better specification-per-dollar ratios in the PS5 and Xbox Series X. Gamers seeking versatile hardware that transitions between portable and television-based play should weigh the Switch 2's unique form factor against its comparatively limited graphical headroom for future titles. For buyers timing their spend around the wider September 2026 hardware window, the phone side of the picture is covered in our iOS 27 beta roadmap, which maps out the iPhone 18 launch window against the same spending month.
Frequently asked questions
Is the Switch 2 significantly slower than the PS5 and Xbox Series X?
On paper, yes. The Switch 2's roughly 4 TFLOPS sits well below the PS5's 10.28 and the Series X's 12, and its 88 GB/s memory bandwidth is a fraction of the consoles' 448 and 560 GB/s.[1][2][3] In practice, native resolutions and settings tiers keep the gap from being the full 3x, and first-party titles are engineered for the hardware. The Switch 2 is a different class of machine, not a discounted version of the same one.
How does DLSS change the Switch 2's effective performance?
DLSS renders internally at a lower resolution and uses AI upscaling to present the frame, which lets the T239 chip spend its budget on frame rate rather than raw pixel count.[4][5] In docked mode this is a meaningful uplift over the raw TFLOPS figure would suggest, and it is the main reason the Switch 2 holds usable frame rates in demanding third-party titles. In handheld mode, thermal limits rather than DLSS set the ceiling.
What is the handheld battery life in real use?
Independent testing puts the Switch 2 in the mid-to-high single-digit hour range for typical gaming, with the exact figure dependent on title, brightness, and whether DLSS is active.[7] Docked, battery is irrelevant and the console runs on external power. For travel and portable play it is the only one of the three that works at all away from a wall socket.
Can you expand the Switch 2's storage, and how fast are the cards?
The Switch 2 takes microSD Express cards, which are UFS-based and substantially faster than legacy microSD, with support for up to 2 TB.[10] Both the PS5 and Series X support third-party NVMe SSDs, which are faster per dollar for bulk game storage. For a portable system, the microSD Express route is the practical choice and keeps the library mobile with the hardware.
Which console is the better buy in 2026?
The Switch 2 at $349.99 is the lowest entry point and the only hybrid, which is a unique value proposition rather than a raw performance story.[8] The PS5 and Series X at $499.99 deliver native 4K-class performance with larger memory pools and higher bandwidth, and they are the buys for TV-first players who want headroom. Game Pass at $16.99 a month is also worth modelling into a three-year budget if library access matters more than hardware specs.
Sources
- Nintendo — Switch 2 Technical Specifications
- PlayStation — PS5 Technical Specifications
- Xbox — Series X Technical Specifications
- Digital Foundry — Switch 2 Technical Analysis
- TechPowerUp — Nintendo Switch 2 GPU Review
- AnandTech — Nintendo Switch 2 Thermal Analysis
- IGN — Battery Life Testing Results
- GamesIndustry.biz — Console Pricing Analysis 2026
- Tom's Hardware — Switch 2 Specifications Analysis
- Eurogamer — Switch 2 Storage Speed Analysis



Loading comments…